There are some similarities between China’s current economic situation and Japan’s in the early 1990s, which led to a decades-long deflationary spiral. These similarities include:
- A property bubble that has burst, leading to falling prices and a large amount of bad debt.
- A slowing economy, with weak investment and consumption.
- An aging population, which is putting a strain on government finances.
- A high level of debt, both in the private and public sectors.
However, there are also some important differences between the two countries. China’s economy is still much larger than Japan’s, and it has a more flexible labor market. This means that China may be able to avoid a prolonged deflationary spiral.
The Chinese government is aware of the risks of deflation, and it has taken some steps to try to prevent it. These steps include cutting interest rates, injecting liquidity into the economy, and stimulating investment. However, it remains to be seen whether these measures will be enough to prevent deflation.
If China does enter a deflationary spiral, it could have a number of negative consequences. Deflation can lead to a vicious cycle of falling prices, lower demand, and further declines in prices. This can make it difficult for businesses to invest and create jobs, and it can also lead to social unrest.
The Chinese government is taking steps to avoid a deflationary spiral, but it is a difficult challenge. If the government is not successful, it could have a major impact on the Chinese economy and the global economy.
Here are some of the things that China can do to avoid a deflationary spiral:
- Continue to cut interest rates and inject liquidity into the economy.
- Stimulate investment in infrastructure and other productive sectors.
- Reform the financial system to reduce the level of debt.
- Promote structural reforms to boost productivity growth.
- Make the labor market more flexible.
- Provide social safety nets to protect the most vulnerable.
It is too early to say whether China will be able to avoid a deflationary spiral. However, the government is aware of the risks and is taking steps to address them. The success of these measures will depend on a number of factors, including the severity of the economic slowdown, the effectiveness of the government’s policies, and the willingness of businesses and consumers to invest and spend.
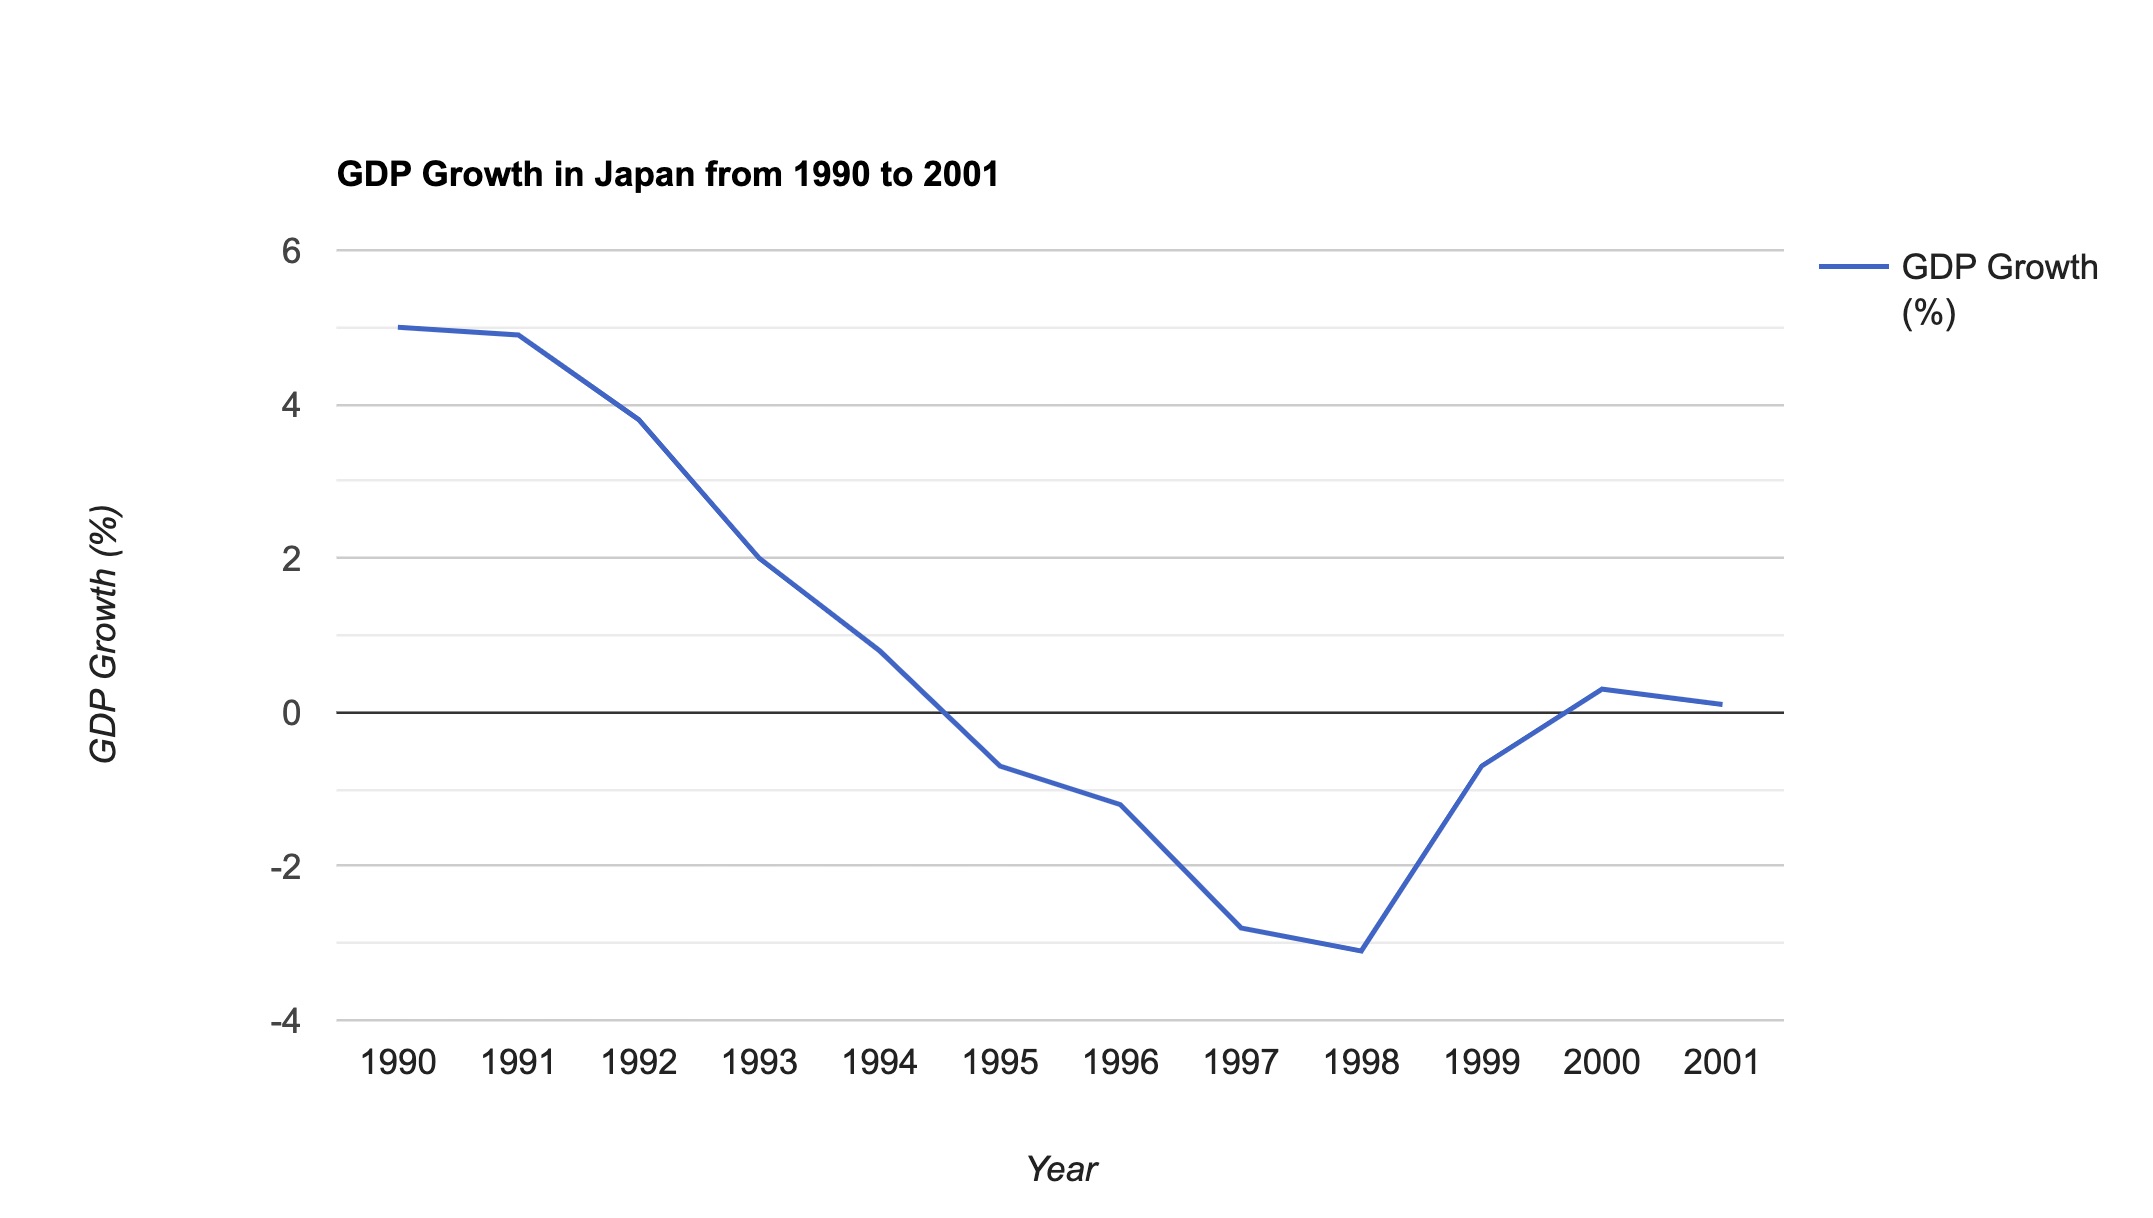
It would be helpful to show two diagrams to illustrate the point. One diagram could show the GDP growth in Japan from 1990 to 2001, the period of the Lost Decade.

The other diagram could show the GDP growth in China from 2022 to 2030, a projected period of economic slowdown.
The first diagram would show a clear decline in GDP growth in Japan from 1990 to 2001. This decline was caused by a number of factors, including the bursting of the Japanese asset bubble, the collapse of the Japanese banking system, and the global economic slowdown of the early 1990s.
The second diagram would show a slower rate of GDP growth in China from 2022 to 2030. This slowdown is expected to be caused by a number of factors, including the aging of the Chinese population, the slowdown of global economic growth, and the increasing debt burden of the Chinese government.
The two diagrams would illustrate the similarities between the economic situations of Japan in the 1990s and China today. Both countries are experiencing a slowdown in economic growth, and both countries are facing a number of challenges, including aging populations, debt burdens, and global economic slowdowns.
However, there are also some important differences between the two countries. Japan’s economy is much smaller than China’s, and China has a more flexible labor market. This means that China may be able to avoid a prolonged economic slowdown.
The future of the Chinese economy is uncertain. However, the two diagrams show that there are some similarities between the economic situations of Japan in the 1990s and China today. These similarities suggest that China may need to take steps to avoid a prolonged economic slowdown.