The AI market has a confidence problem that a headline about another chip order cannot resolve. Share prices are weakening across the trade even as corporate messaging remains optimistic and speculative traders keep leaning bullish. That is the tension captured by the AI Market Analyzer at MarketAnalysis.com, which records a reading of 32 out of 100 for the October 30, 2026 close. The dashboard places that reading in its Cooling zone, unchanged from a week earlier but down from 70 a month ago and 85 a year ago. On this measure, the market has moved from hype toward caution without reaching the deepest fear category.
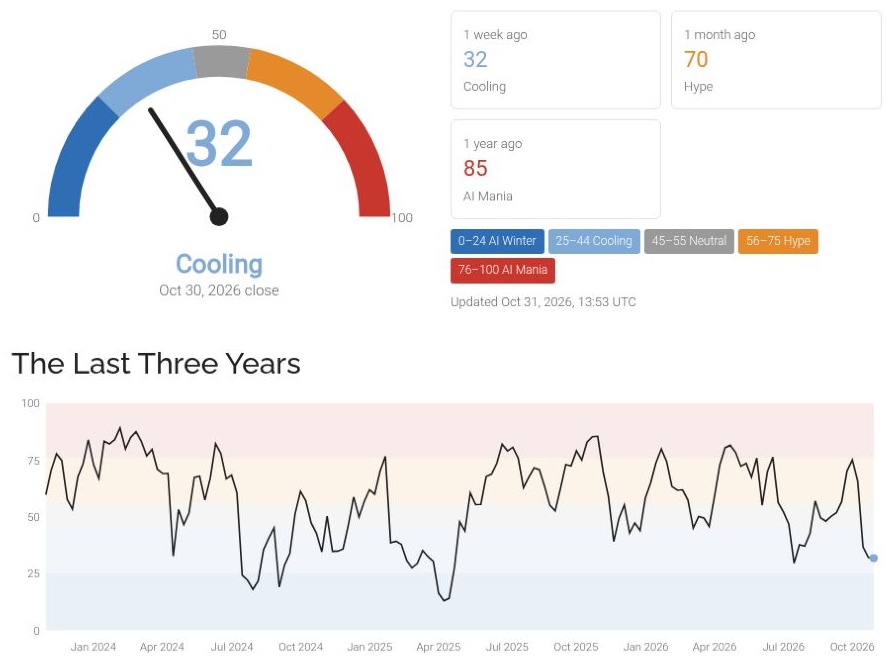
The screenshot makes the change unusually easy to see. A semicircular gauge moves from dark and pale blues on the left through gray at the midpoint to orange and red on the right, with a black needle pointing into the blue and a large 32 above the label Cooling. Comparison cards beside it show the same 32 a week earlier, an orange 70 for the previous month and a red 85 for the previous year. Beneath them, a black line crosses pale horizontal sentiment bands across nearly three years, ending with a sharp descent to a blue marker near 32. There have been several rises and retreats along that line. The latest drop is conspicuous, though the chart alone cannot tell us whether the next move will be a recovery or another leg down.
The underlying indicators explain why the headline score deserves attention. Momentum scores just 8, with the AI basket 6.2 percent below its 25-week average. Relative strength scores 1, reflecting a four-week return that trails the S&P 500 by 12.8 percentage points. Breadth scores 6, with only 6 percent of the tracked names above their own 10-week averages. These are three related observations rather than three wholly independent discoveries, but together they describe weakness that extends beyond a single disappointing stock. The basket is below trend, losing ground against the broader market and struggling to produce widespread participation.
Then comes the awkward part. Speculation scores 87, firmly in the analyzer’s AI Mania zone, while its corporate sentiment input scores 82. The speculation measure reports that the bullish SOXL fund accounts for 69 percent of combined SOXL and SOXS trading over two weeks. That is a measure of activity in a particular pair of leveraged semiconductor ETFs, not proof that 69 percent of all investors are bullish. Still, its contrast with poor momentum is revealing: enthusiasm for a leveraged rebound can survive well after the wider trade loses strength. The corporate sentiment reading, derived from guidance and press release signals tracked through k4i.com, points to a similarly upbeat tone on the business side. Neither signal guarantees that buyers will pay higher prices for the shares.
Our reading of this split is that the market is testing the price attached to the AI story. Expectations for future demand and the return investors require today can move in different directions. A company can describe a promising outlook while its shares remain under pressure if that promise was already embedded in the valuation. The dashboard does not establish which economic force caused the retreat, and it does not measure the entire AI economy. It does, however, provide a useful check on the temptation to treat optimistic announcements as evidence that the stock market must also be healthy.
The construction of the index matters here. It averages seven scores, six based on market data and one on corporate communications. Its stated equity basket contains 18 names spanning chips, manufacturing equipment, networking, power infrastructure, cloud platforms and software, including NVIDIA, TSMC, ASML, Arista Networks, Vertiv, Microsoft, Amazon and Palantir. The market-based inputs are ranked against their own two-year histories. A low score therefore describes conditions relative to that history; it is neither a probability of a crash nor a direct estimate of fair value. Averaging also softens the extremes: a composite of 32 can coexist with individual readings near the bottom and others above 80.
For now, the most useful question is whether the gap begins to close. Improving breadth and relative strength would give an AI recovery a firmer market foundation. Continued price weakness alongside bullish leverage and optimistic messaging would leave the same tension unresolved. The current reading supports caution about the health of the AI stock trade, while leaving open the longer-term business case for AI investment. Readers can follow the changing inputs and methodology on the original AI Market Analyzer dashboard. All figures above refer to the snapshot reviewed on October 31, 2026; subsequent readings will change.